| эъЗИыЃЈ, ыАъЗэ, ьЁАэь, ььАНьА, ььЅь, ьЄьЄьВ , ьДьАэЌ, ыАьЂ
ь , ь ыъЕЌ, ъЙььЁА, ьЌыДь |
Background: Diastolic vortex in the LV reflects the interplay between chamber function, geometry and myocardial mechanics. Changes in diastolic LV vortex flow pattern may closely correlate with early diastolic dysfunction. The aim of this study was to assess implication of LV vortex flow parameters by contrast echocardiography (CE) in normal and patients with diastolic dysfunction (DD).
Methods: 50 patients underwent 2-D CE with IV infusion of DefinityТЎ (Lantheus Medical Imaging, Inc. North Billerica, MA) and imaged at an mechanical index of 0.4-0.6. Study population divided into three groups, group 1: normal control (n=15), group 2: mild to moderate DD (n=25), and group 3: severe DD (n=10). The vorticity was estimated using Omega flowТЎ (Siemens Medical Solutions, Mountain View, CA) and compared between three groups. Vortex depth, length, width (VD, VL, VW) and sphericity index (SI) were measured as average vortex parameter. Relative strength (RS) and vortex relative strength (VRS) were estimated as pulsatility parameter. Maximal and minimal vortex size (max-VS, min-VS,%), phasic variation in the vortex flow size (PV-VS,%) relative to LV size were also measured.
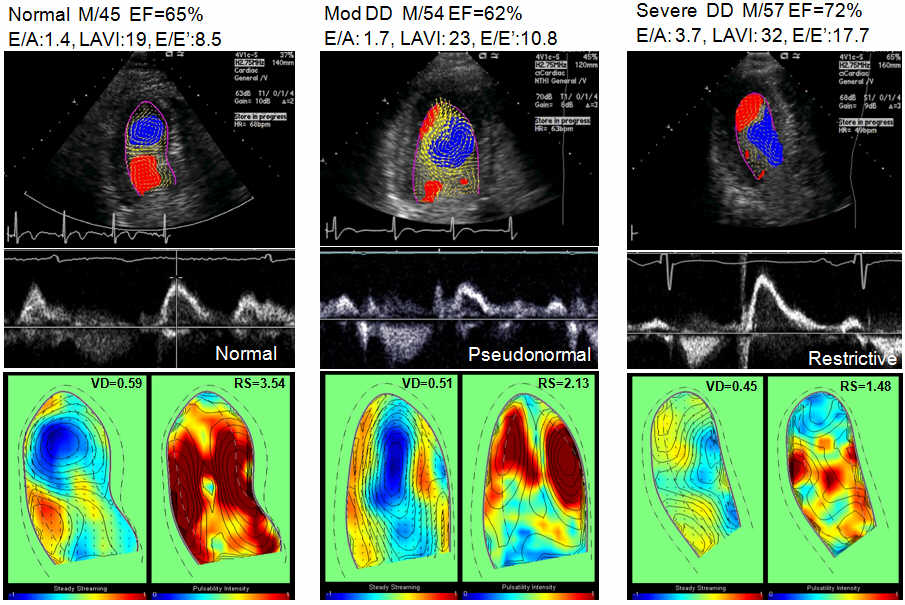
Results: VD was significantly lower in group 3 (0.466ТБ0.05 vs 0.482ТБ0.06 vs 0.513ТБ0.05, p=0.05 respectively). RS (1.42ТБ0.6 vs 1.89ТБ0.5 vs 2.49ТБ0.9, p=0.01 respectively), and VRS (0.92ТБ0.5 vs 1.14ТБ0.4 vs 1.60ТБ0.5 p=0.01 respectively) were significantly lower in DD group compare with normal. Min-VS was significantly smaller in group 3 (11.7ТБ5 vs 29.5ТБ13 vs 32.5ТБ11 respectively) than other groups. Figure shows echo freeze frame and parametric representations of steady streaming flow field (lower left panel) and the pulsatile strength field (lower right panel) in normal, and patients with moderate and severe diastolic dysfunction.
Conclusions: LV vorticity parameters can reflect early changes of diastolic dysfunction. Quantitative LV flow vortex analysis using CE is a novel method to predict LV diastolic dysfunction
|