| єя«•«ьљƒ : ±Єњђ
|
ЅҐЉцєш»£ - 540744 51 |
| Is Left Ventricular Vortex Flow Related To The Clinical Response To Cardiac Resynchronization Therapy? ; A Quantitative Vorticity Imaging Study Using Contrast Echocardiography |
| мШБлВ®лМАнХЩкµРл≥СмЫР мИЬнЩШкЄ∞лВік≥Љ¬є |
| мЖРмЮ•мЫР¬є, мЭіл≥ік≤љ¬є , мЖРм∞љмЪ∞¬є, мЬ§м§Ам≤†¬є, м°∞нШДмИШ¬є, мЭімГБнЭђ¬є,нЩНкЈЄл£®¬є,л∞ХмҐЕмД†¬є,мЛ†лПЩкµђ¬є,кєАмШБм°∞¬є,мЛђліЙмД≠¬є |
Background: Evaluating and optimizing appropriate response after cardiac resynchronization therapy (CRT) is challenging issue. Currently used criteria for evaluating response were mainly focused on left ventricular (LV) mechanical dyssynchrony, however, there was no study focusing on LV flow pattern. The aim of this study was to assess the usefulness of LV vortex flow analysis for evaluating response to CRT.
Methods: Fifteen patients who received CRT (10 responder group and 5 non-responder group) underwent two-dimensional (2D) transthocacic contrast echocardiography (CE) with intravenous infusion of Definity¬Ѓ (Lantheus Medical Imaging, Inc. North Billerica, MA) and imaged at an mechanical index of 0.4-0.6 in the A4C and APLX views after CRT. Quantitative LV vortex flow parameters including morphology and pulsatility were measured using Omega flow¬Ѓ (Siemens Medical Solutions, Mountain View, CA) and compared between two groups. The dynamic variation of vortex were estimated by means of maximal and minimal vortex flow size (TVS, %) and phasic variation in the vortex flow size (PV-TVS, %).
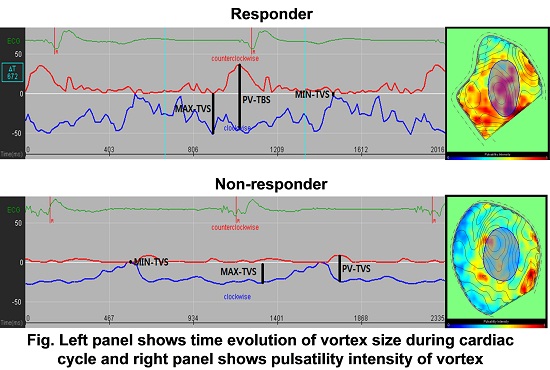
Results: The morphologic and pulsatility parameters of LV vortex flow did not showed significant difference between two groups. However, PV-TVS was significantly larger in responder group than non-responder group (61.6±14.8 vs 33.7±2.3, p < 0.05). But there were no significant difference in maximal-TVS (Max-TVS) and minimal-TVS (Min-TVS) between two groups. Figure shows phasic variation of vortex size during cardiac cycle (Lt panel) and parametric representations of the pulsatile strength field (right panel) in responder and non-responder group.
Conclusions: Quantitative LV vortex flow analysis may have potential role for evaluating response after CRT.
|
|
|
Warning: getimagesize(/home/virtual/circulationadmin/renewal/econgress/conference/abstract/img_files/vortex.jpg) [function.getimagesize]: failed to open stream: No such file or directory in /home/virtual/circulationadmin/new/econgress/conference/manage/schedule/view_abstract.php on line 164
|
|