| №ЯЗҘЗьҪД : ЖчҪәЕН
|
Бўјц№шИЈ - 550971 57 |
| Comparison of Endothelial Coverage and Stent Malapposition between Infarct-related and non-infarct Coronary Lesions Treated with Everolimus-eluting Stents; Optical Coherence Tomography Analysis |
| м—°м„ёлҢҖн•ҷкөҗ мӣҗмЈјмқҳкіјлҢҖн•ҷ, мӢ¬мһҘлӮҙкіј |
| м•Ҳм„ұк· , мңӨм •н•ң, мқҙм§Җнҳ„, к№Җмҡ°нғқ, мқҙмӨҖмӣҗ, мңӨмҳҒ진, м•ҲлҜјмҲҳ, к№ҖмһҘмҳҒ, мң лі‘мҲҳ, мқҙмҠ№нҷҳ, мөңкІҪнӣҲ |
Background and objectives To compare the mid-tem vascular response between acute myocardial infarction (AMI) and non-AMI settings after everolimus-eluting stent (EES) implantation using optical cohererence tomography (OCT).
Methods The present study was conducted as a cross-sectional observational study with prospective OCT registry. A total 48 coronary lesions (12 AMI, 36 non-AMI) was evaluated by OCT at 12 months after EES implantation. The percentage of neointimal hyperplasia (NIH) area at every 1 mm cross section was measured. The degree of neointimal coverage and the prevalence of malapposition were compared between infarct-related and non-infarct coronary lesions.
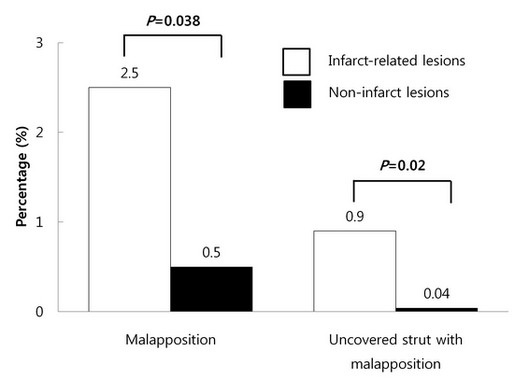
Results The percentage of NIH and prevalence of uncovered strut were similar in both groups (Table). The prevalence of malapposition and malapposition with uncovered strut were significantly higher in infarct-related lesions than non-infarct coronary lesions (2.1Вұ3.1 vs. 0.5Вұ1.2, P=0.038 and 0.9Вұ1.6 vs. 0.05Вұ0.2, P=0.02, respectively) (Figure).
Conclusions Neoinitimal coverage occurred similarly in infarct-related and non-infarct coronary lesions. But stent malapposition developed higher in infarct-related lesions than non-infarct coronary lesions.
|
|
Table. Optical coherence tomography (OCT) measurements at 12 months
|
Tomography measurements |
Infarct-related lesions (n=12) |
Non-infarct lesions (n=36) |
P value |
|
Cross sections (n) |
290 |
926 |
|
|
Mean stent area (mm2) |
7.3Вұ1.8 |
7.7Вұ2.2 |
0.601 |
|
Mean lumen area (mm2) |
6.5Вұ1.6 |
6.9Вұ2.3 |
0.607 |
|
Mean NIH area (mm2) |
0.9Вұ0.4 |
0.8Вұ |
0.972 |
|
Percentage of NIH |
10.9Вұ4.1 |
11.2Вұ6.7 |
0.903 |
|
Percentage of uncovered struts |
10.5Вұ11.1 |
17.8Вұ16.3 |
0.158 |
|
Warning: getimagesize(/home/virtual/circulationadmin/renewal/econgress/conference/abstract/img_files/OCT_AMI_nonAMI1.jpg) [function.getimagesize]: failed to open stream: No such file or directory in /home/virtual/circulationadmin/new/econgress/conference/manage/schedule/view_abstract.php on line 164
|
|